LineChart
Draws a line chart.
Examples
LineChart 1
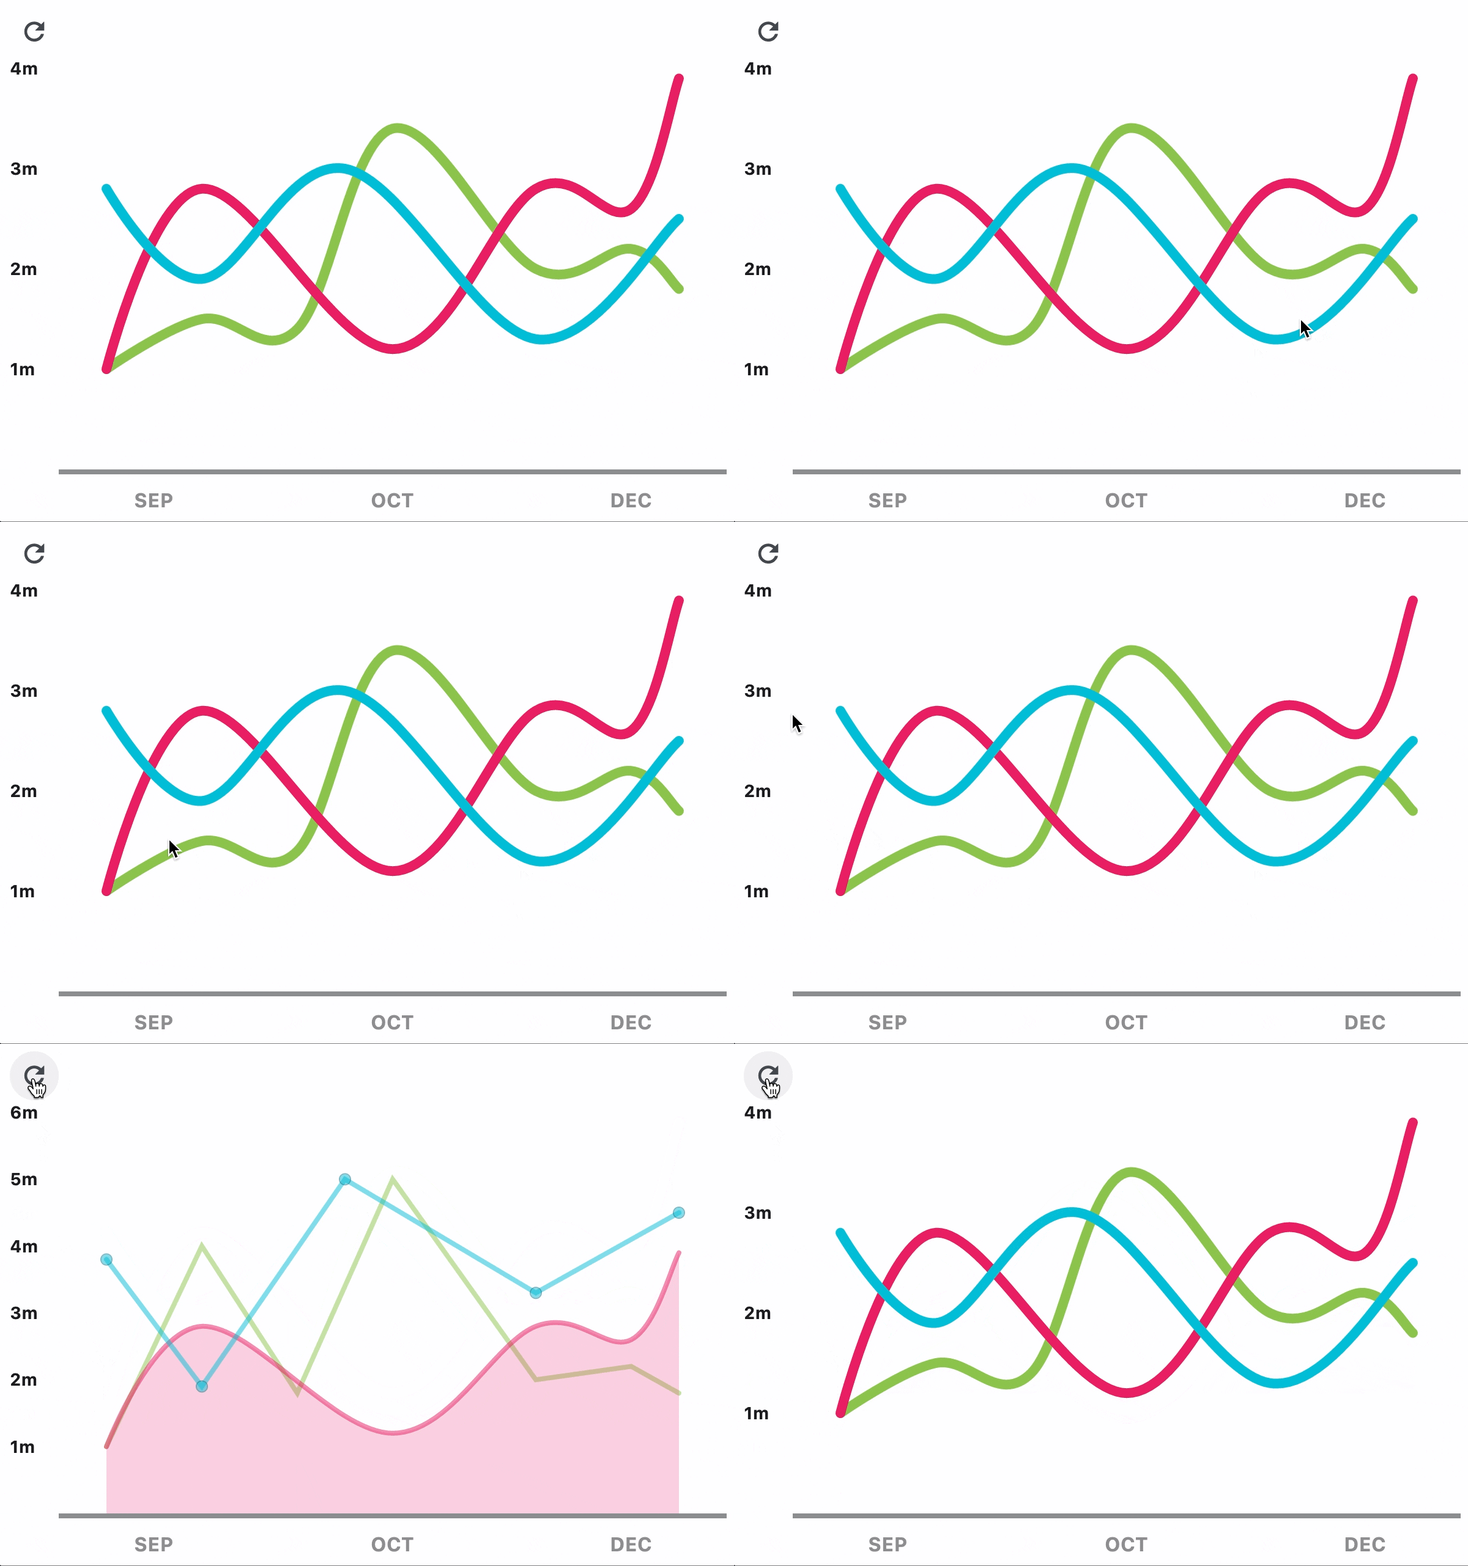
loading...
LineChart 2
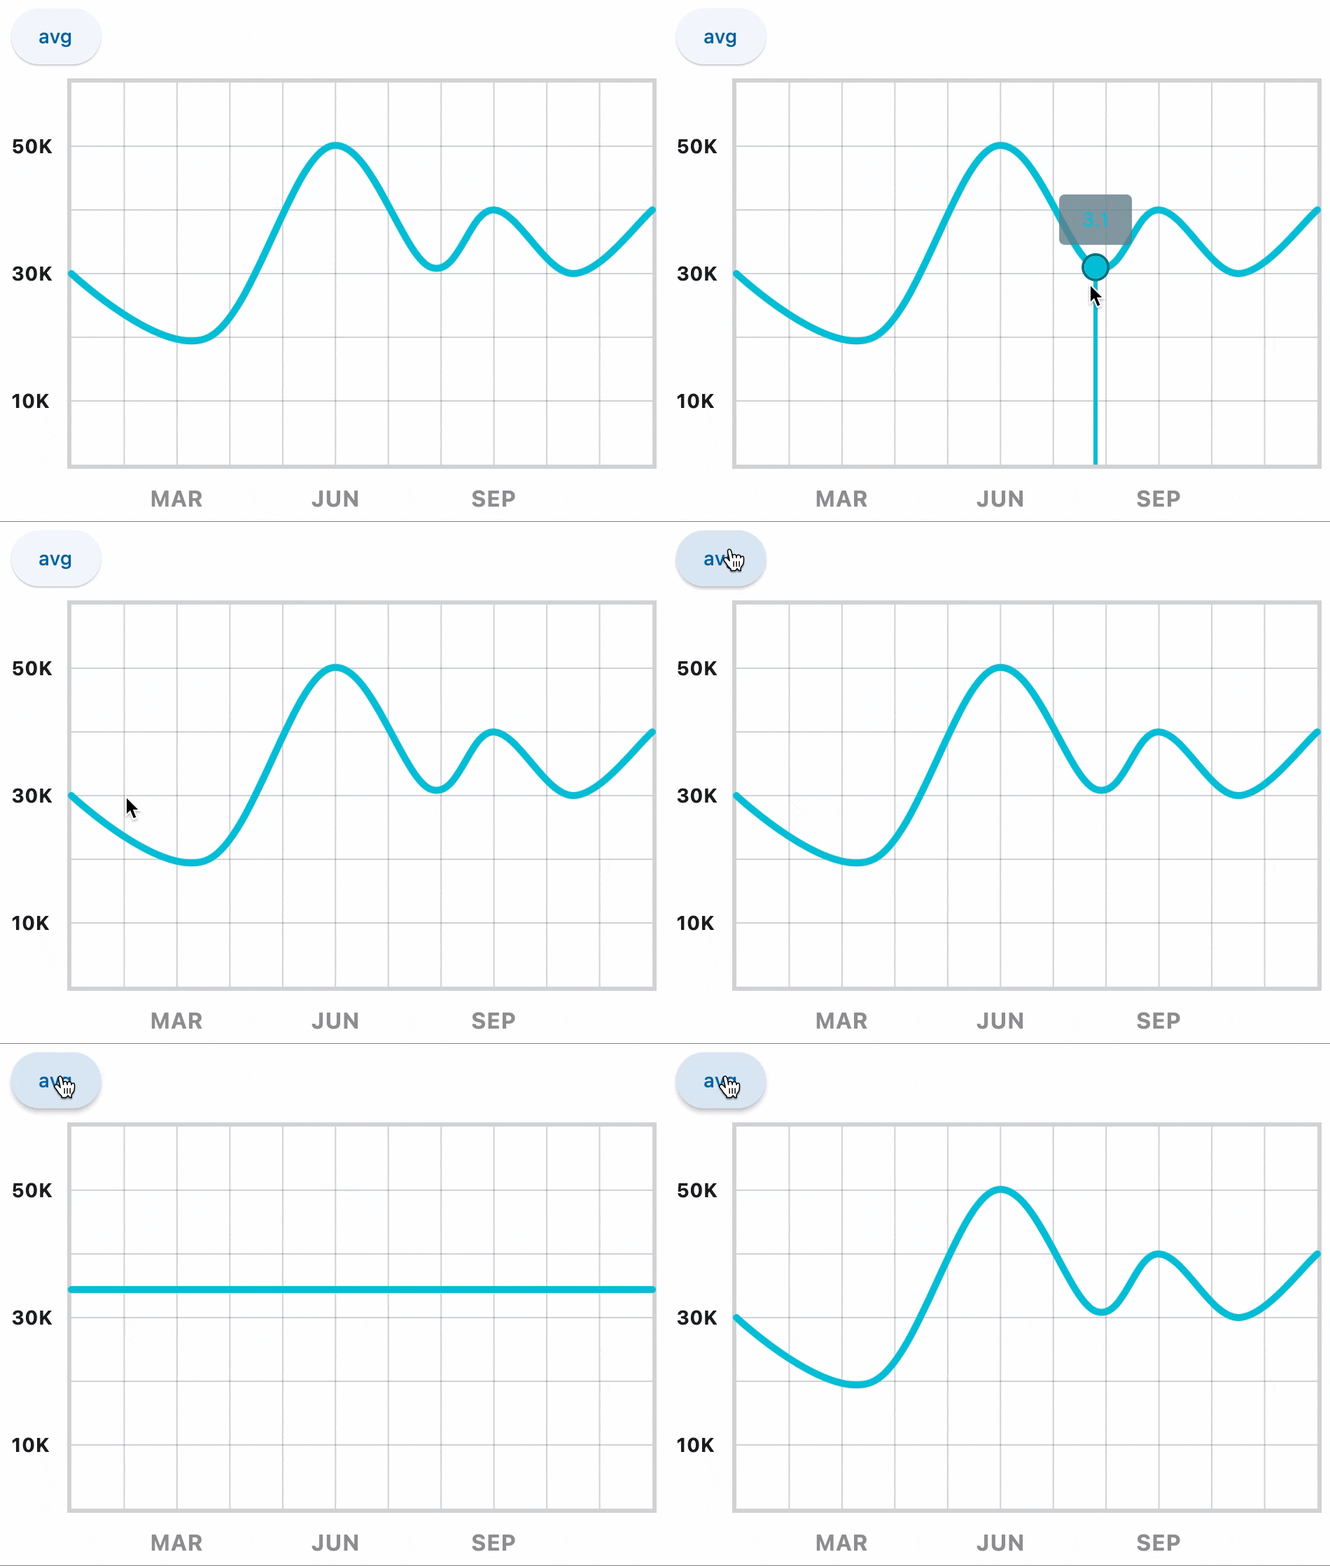
loading...
Properties

animate
Controls chart implicit animation.
Value is of type AnimationValue.
baseline_x
Baseline value for X axis.
Defaults to 0.
baseline_y
Baseline value for Y axis.
Defaults to 0.
bgcolor
Background color of the chart.
border
The border around the chart.
Value is of type Border.
bottom_axis
Defines the appearance of the bottom axis, its title and labels.
Value is of type ChartAxis.
data_series
A list of LineChartData controls drawn as separate lines on a chart.
horizontal_grid_lines
Controls drawing of chart's horizontal lines.
Value is of type ChartGridLines.
interactive
Enables automatic tooltips and points highlighting when hovering over the chart.
left_axis
Defines the appearance of the left axis, its title and labels.
Value is of type ChartAxis class.
max_x
Defines the maximum displayed value for X axis.
max_y
Defines the maximum displayed value for Y axis.
min_x
Defines the minimum displayed value for X axis.
min_y
Defines the minimum displayed value for Y axis.
point_line_end
The end of the vertical line drawn at selected point position.
Defaults to data point's y value.
point_line_start
The start of the vertical line drawn under the selected point.
Defaults to chart's bottom edge.
right_axis
Defines the appearance of the right axis, its title and labels.
Value is of type ChartAxis class.
tooltip_bgcolor
Background color of tooltips.
tooltip_border_side
The tooltip border side.
tooltip_direction
Controls showing tooltip on top or bottom.
Value is of type TooltipDirection and defaults to TooltipDirection.AUTO.
tooltip_fit_inside_horizontally
Forces the tooltip to shift horizontally inside the chart, if overflow happens.
Value is of type bool.
tooltip_fit_inside_vertically
Forces the tooltip to shift vertically inside the chart, if overflow happens.
Value is of type bool.
tooltip_horizontal_offset
Applies horizontal offset for showing tooltip.
tooltip_margin
Applies a bottom margin for showing tooltip on top of rods.
tooltip_max_content_width
Restricts the tooltip's width.
tooltip_padding
Applies a padding for showing contents inside the tooltip.
Value is of type PaddingValue.
tooltip_rounded_radius
Sets a rounded radius for the tooltip.
tooltip_rotate_angle
The rotation angle of the tooltip.
tooltip_show_on_top_of_chart_box_area
Whether to force the tooltip container to the top of the line.
Value is of type bool and defaults to False.
top_axis
Defines the appearance of the top axis, its title and labels.
Value is of type ChartAxis.
vertical_grid_lines
Controls drawing of chart's vertical lines.
Value is of type ChartGridLines.
Events
on_chart_event
Fires when a chart line is hovered or clicked.
Value is of type LineChartEvent.